Toolbox: Productivity

Toolbox: Productivity Option
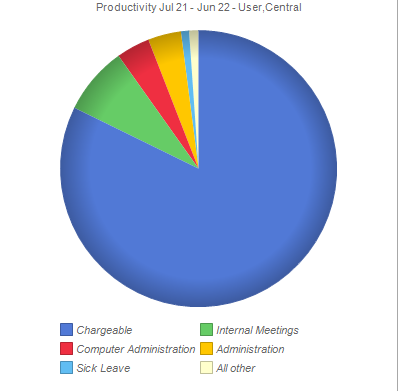
When you drag the Productivity option from the Toolbox, you see a pie chart of that represents the practice productivity. For exact figures hover your mouse over the various segments of the chart.
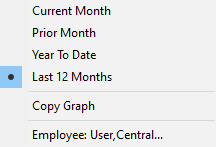
Right-click the display to show the pop-up menu to sort by current or prior month or year to date for the past 12 months.
Users can double click on any segment of the pie chart to drill down to a grid showing the transcations relating to the segment of the pie chart has been chosen i.e. Chargeable, Internal Meetings, Sick Leave etc